 Laravel Development
 React Development
 Vue.js Development
 Angular Development
 Python Development
 Flutter Development
 iOS/Swift Development
 DigitalOcean Development
 AWS Development
 Azure Development
 ConnectShip Services
Analytics for Mobile Apps
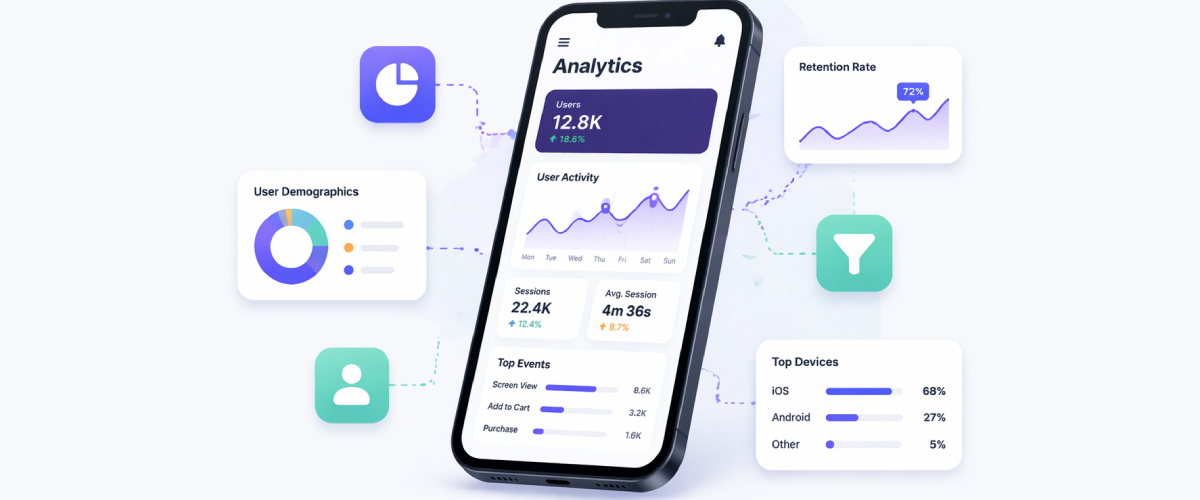
Mobile Analytics: Understanding Your App's Data
Mobile analytics is a sea full of fishes (numbers) that you may want to reel out sooner or later. Although, apparently this sea is not full of fishes meant for all kinds of fishermen. So for you, the first thing you need to decide is what kind of fisherman you are, determining what kind of fish you need to reel out.

Targeted statistics are generally more accurate and usable as compared to a cluster of numeric information that may not lead to incisive decision-making. As far as any business is concerned, growth is the ultimate motive, and of course, only the right decisions help you sustain the competition. Mobile devices are taking over the internet from desktop devices, and mobile apps are taking over user engagement from websites. If your traffic is coming to your mobile app, you ought to make sure your analytics team makes those numbers count.

Google Analytics lets you combine marketing data from Adwords, AdMob, Google Play, and App Store and understand how users engage with your app. The data can offer insights about your audience and help you better target your ads. By including analytics tracking coding, you can analyse each user's interaction actively using your app. This is referred to as a session. Google Analytics then processes each session to create various reports about user behavior. Using all these tools together can help you promote your app to new users, measure user behavior, and better understand the performance of your marketing and advertising.
Choosing the Right Monetization Model
There are three kinds of monetization model:
- Paid App downloads
- In-app purchases
- In-app ads
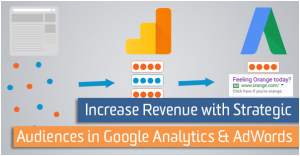
More than 90% of apps today are free, however in many key markets, in-app ads constitute more than 60% of total app revenue, which is set to grow further. In 2017, the mobile app advertising market was expected to grow up to 62 billion dollars. Showing the right ad at the right time is crucially important.
Google AdMob, with one of the best machine learning systems, can predict based on user behavior who is likely to make in-app purchases and who is more likely to engage in non-payable facilities. The idea is to hybridize in-app purchases with in-app ads, not focusing on one. The integration of Google Analytics and Google AdMob allows app developers to leverage Custom Audience Targeting while users get the value they chose or chose not to pay for.

Identifying Revenue Roadblocks
Roadblocks to revenue could be anything from a design issue to a problem with the registration process. Removing these roadblocks helps you monetize users more efficiently. You can compare monetized and non-monetized users by analyzing screen reports. Google Analytics or AdMob can help you identify higher exit points on a screen, indicating potential roadblocks like difficult game levels or technical issues. Event tracking allows analysis of whether non-monetized users leave your app after specific interactions. Device reports help spot technical issues on specific devices or operating systems.
Crashlytics & Fabric.io

Fabric.io is a Twitter-owned analytics application integrating three mobile app products, including Crashlytics. Crashlytics analyses and reports crash details across your entire user base. These statistics are real-time and include which line of code caused the crash. Crashlytics allows analysis down to a specific user tracked with a user tracking ID. Stability should be a main concern for app developers.

Fabric enables leveraging identity, distribution channels, and monetizing your user base, all on top of your app’s foundation. If your app’s foundation isn’t stable, it is incredibly difficult to be successful. Crashlytics can help identify potential roadblocks to revenue, and the data is automatically sent to your reports. You can also analyze how much monetary loss these crashes are causing.